ggmatplot is a quick and easy way of plotting the columns of two matrices
or data frames against each other using
ggplot2.
ggmatplot(
  x = NULL,
  y = NULL,
  plot_type = c("point", "line", "both", "density", "histogram", "boxplot", "dotplot",
    "errorplot", "violin", "ecdf"),
  color = NULL,
  fill = NULL,
  shape = NULL,
  linetype = NULL,
  xlim = c(NA, NA),
  ylim = c(NA, NA),
  log = NULL,
  main = NULL,
  xlab = NULL,
  ylab = NULL,
  legend_label = NULL,
  legend_title = NULL,
  desc_stat = "mean_se",
  asp = NA,
  ...
)
Arguments
- x, y
Vectors or matrices of data.
The number of rows of
xandyshould be the same.Either
xoryshould be a vector, unless the number of columns ofxandyare the same.Missing values (NAs) are allowed.
If either
xoryis missing, the other is used asyand a vector of1:nis used asx.
- plot_type
A string specifying the type of plot. Possible plot types are
point,line,both(point + line),density,histogram,boxplot,dotplot,errorplot,violin, andecdf. Default plot_type ispoint.- color, fill
Vectors of colors. Defining only one of them will update both
colorandfillaesthetics of the plot by default, unless they are both defined simultaneously.The number of colors should match the higher number of columns of matrices
xory, and will correspond to each of those columns.If only a single color is given, the same color will be used for all columns.
- shape, linetype
A vector of shapes or line types respectively.
The number of shapes/line types should match the higher number of columns of matrices
xory, and will correspond to each of those columns.If only a single shape/line type is given, the same shape/line type will be used for all columns.
- xlim, ylim
Ranges of x and y axes.
Each of them should be a two element vector specifying the lower and upper limits of the scale.
If the larger value is given first, the scale will be reversed. If one of the limits is given as
NA, the corresponding limit from the range of data will be used.
- log
A string defining which axes to transform into a log scale. (
x,yorxy)- main, xlab, ylab, legend_title
Strings to update plot title, x axis label, y axis label and legend title respectively.
- legend_label
A vector of strings, to rename the legend labels.
- desc_stat
Descriptive statistics to be used for visualizing errors, in
errorplot. Possible values aremean_se,mean_sd,mean_range,median_iqrandmedian_range. Default desc_stat ismean_se.- asp
The y/x aspect ratio.
- ...
Other arguments passed on to the plot. Possible arguments are those that can be passed on to the underlying ggplot layers.
Value
A ggplot object. The columns of the input matrices will be plotted against each other using the defined plot type.
Plot Types
ggmatplotplots are built upon ggplot2 layers. The following is a list of
ggmatplot plot types, along with their underlying
ggplot geoms
or stats.
point
geom_pointline
geom_lineboth
geom_point+geom_linedensity
geom_densityhistogram
geom_histogramboxplot
geom_boxplotdotplot
geom_dotploterrorplot
geom_pointrangeviolin
geom_violinecdf
stat_ecdf
Examples
# Define a data set
iris_sub <- subset(iris, Species == "setosa")
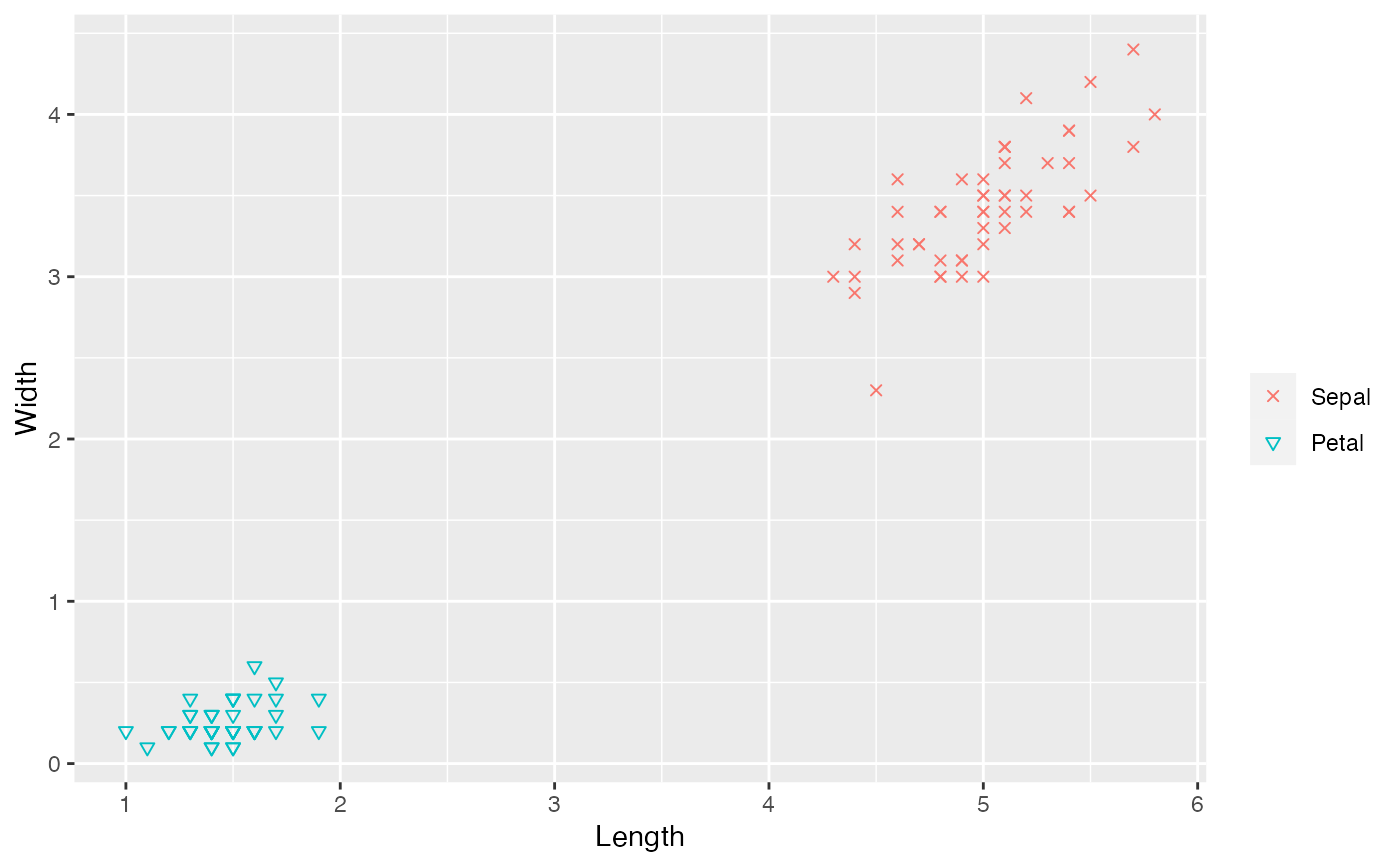
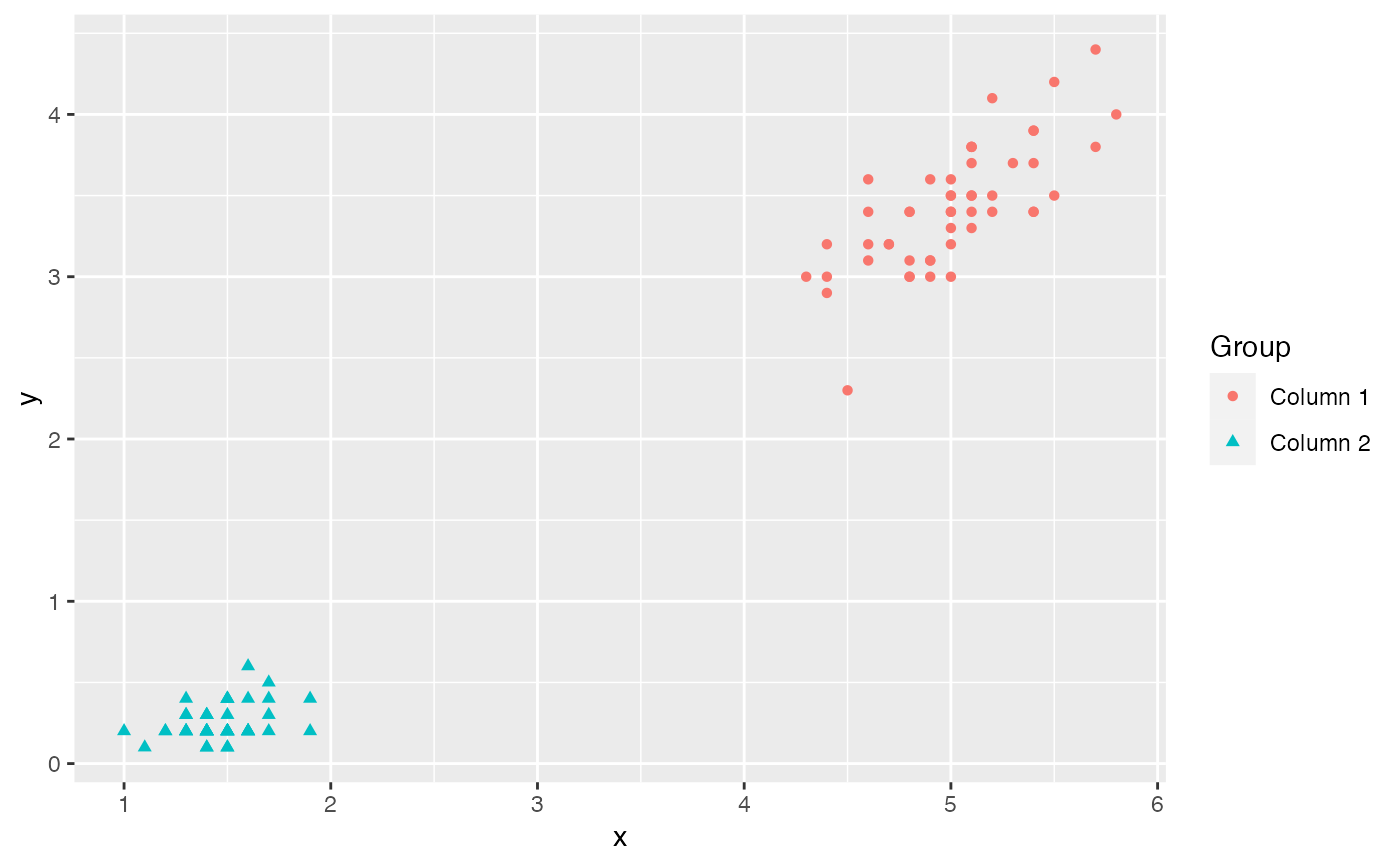
ggmatplot(iris_sub[, c(1, 3)], iris_sub[, c(2, 4)])
 # Modify legend label and axis
ggmatplot(iris_sub[, c(1, 3)], iris_sub[, c(2, 4)],
shape = c(4, 6),
legend_label = c("Sepal", "Petal"), legend_title = "",
xlab = "Length", ylab = "Width"
)
# Modify legend label and axis
ggmatplot(iris_sub[, c(1, 3)], iris_sub[, c(2, 4)],
shape = c(4, 6),
legend_label = c("Sepal", "Petal"), legend_title = "",
xlab = "Length", ylab = "Width"
)